Welcome
This will be a dashboard for our analytics. Below you will see your respective tabs where your reports will live. Below that are terms/options for our reports.
SUZANNE
Under your tab (below) you will find a recently created report that is scheduled to come to you and I every month on the 7th. I threw a few things on it that I think you would find interesting, but we can always add more pages to the reports.
MELANIE
Your report link currently still goes to an old report. Once we have the new one fine-tuned, it will live here and I will schedule it as well.
Take a look at the terms and other reports on the page to see if there is anything else you would like added.
Data Reports
For Suzanne
This report is currently scheduled be emailed to you and I monthly, but will also live here and automatically refresh with the previous 4ish weeks' data.
For Melanie
Data Options
In order to create a report, you have to have at least one dimension, and at least one metric.
Dimensions
An attribute/action of the site visitor
- Gender
- Browser
- Chrome, Explorer, Firefox, etc.
- Country
- Device
- Mobile, tablet, desktop
- Time of Day
- Source - the channel they accessed our site from
- Facebook, Google, Emma, etc.
- Medium -
- Email, post, ad, organic
- Referral - An external website that sent people to our page via a link
- Referral Path - The specific page within the referral
- Landing Page - The page did the user land on to enter our site
Metrics
A measurement/number
- Pageviews
- Options: Unique and regular
- Sessions
- Session duration - How long the session lasted
- Pages per Session -How many pages the user accessed one average for each session
- Users
- Options: New, unique and all
- Exit Rate - How many people ended their session on this page
- Bounce Rate - How many people ended their session on this page and this was the only page they visited
- A "bounce" is worse than an "exit"
Below, you will see an old report for Suzanne that includes more ideas on what is available.
Old Report
FROM 5/14/19
Traffic Over the Year
Since we do not have a year's worth of data for the new site, I pulled traffic hits from the last two years leading up to the new website.
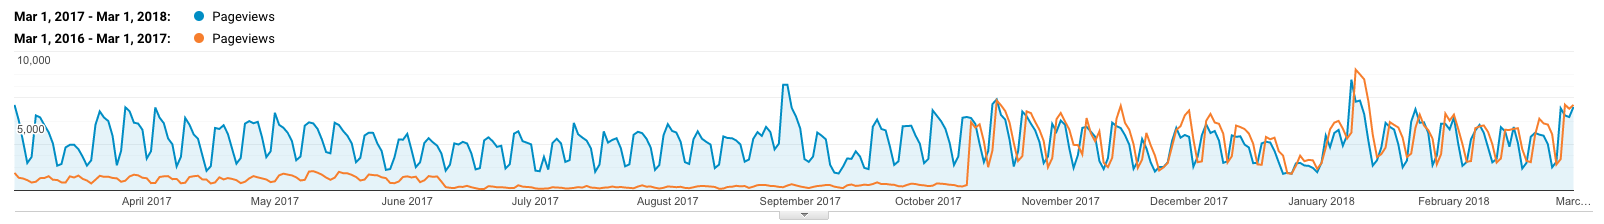
*Ignore the dates at the bottom of this graph, not sure why they are there.
September and January seem to be our two biggest months which makes sense with the start of the fall and spring semesters.
New Website Traffic
New Site | April 1st to Today
Black lines mark Sundays.
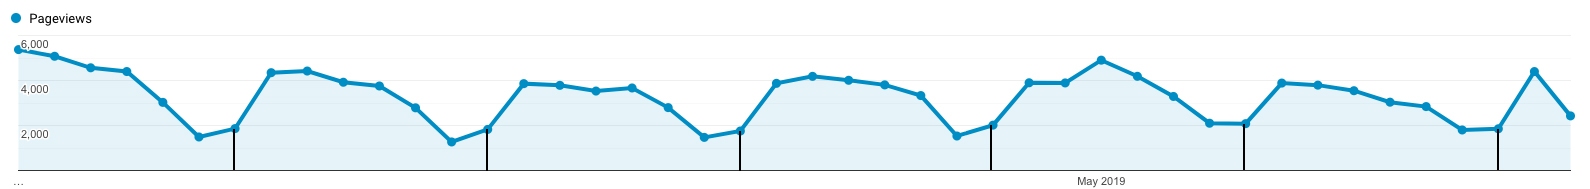
This is a bit hard to read since the days are not listed, but Mondays are usually the highest points and it slowly goes down from there. This was the same on the old website.
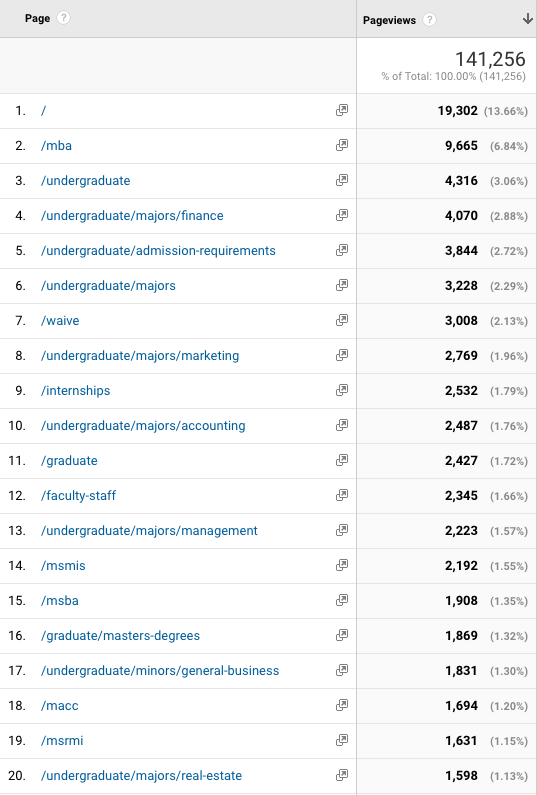
Top Page Visits
Below are the most popular pages. You will notice a few have stayed the same. Analysis below.
New Site | April 1st to Today
Collected data up to this point.
Old Site | March 25th, 2018 to March 25th, 2019
Entire year leading up to the launch.
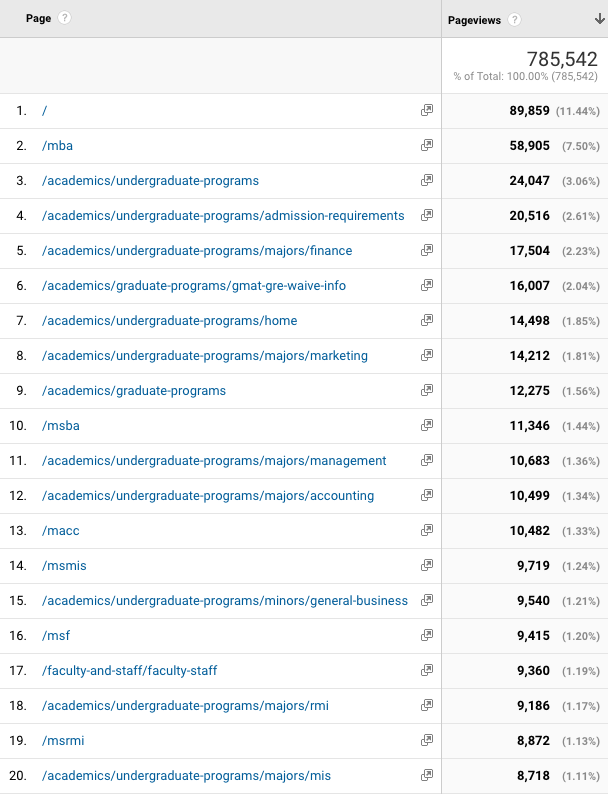
The only difference I really see is the internships page getting more hits. The graduate programs page is extremely consistent (as Mike pointed out), at 3.06%. Other than that, undergraduate programs and the GMAT waiver page are getting the most attention followed by individual graduate program pages.